Jialiang Xie1,
Minghui Zhou1,
Audris Mockus2,
Xiujuan Ma1 and
Hong Mei1
1School of Electronics Engineering and Computer Science, Peking University
Key Laboratory of High Confidence Software Technologies, Ministry of Education
Beijing 100871, China
![]()
To answer these questions we first performed a qualitative study to understand the nature of these practices and their importance to the projects. In Gnome and Mozilla bug triaging (a common way to refer to practices used to report and resolve issues) was of great importance and participants primarily used issue tracking system both, to understand what is going on and to change some key practices. ``Processes that limit the size or potential of our community limit Mozilla. Conversely, making it easier for people to cooperate, collaborate, experiment and play enhances the community's capacity'', according to a volunteer group developing community management metrics and tools for Mozilla. It is, therefore, critical to understand practices employed by a project and to address their weaknesses. Otherwise valuable contributors might leave. For example, one long-time contributor left ``because of a general lack of interest in doing anything substantial to improve the Triage process''.
Issue-tracking systems are widely used in software projects and they
record the way tasks are assigned, problems are discussed, and
issues are resolved. Such data contains a detailed history of the
project and might provide a way to find out decisions that were
problematic or practices that proved beneficial. To cope with
complexity of issue tracking data we developed Practice
Evolution Explorer, (![]() ) to
spot anomalies,
and to quantify relevant
measures of service quality (delay and effort). It visualizes
transitions between states, time trends, and issue attributes and,
based on these views, lets user select subsets of
interest.
) to
spot anomalies,
and to quantify relevant
measures of service quality (delay and effort). It visualizes
transitions between states, time trends, and issue attributes and,
based on these views, lets user select subsets of
interest.
Using Gnome project we illustrate how we used the tool to detect several dramatic changes in the issue tracking practices and how the tool could be used to rapidly detect the impact of new technology and to find effective solution.
We make two contributions: First, ![]() helps to detect
anomalies (and thus, evolution) in issue resolution practices.
Second, it may help to design better practices and to avoid costly
mistakes by quantifying the potential implications for quality and effort.
helps to detect
anomalies (and thus, evolution) in issue resolution practices.
Second, it may help to design better practices and to avoid costly
mistakes by quantifying the potential implications for quality and effort.
We illustrate ![]() with two scenarios of practice changes discovered
in Gnome in Section II, and describe design
considerations
and other details in Section III and Section IV.
The related work is presented in Section V. Future work
and summary are in the last section.
with two scenarios of practice changes discovered
in Gnome in Section II, and describe design
considerations
and other details in Section III and Section IV.
The related work is presented in Section V. Future work
and summary are in the last section.
We illustrate ![]() on a large Bugzilla repository of Gnome software
eco-system. Gnome implements user interface functionality, and has
more than 10 years of history and more than 600K issues.
on a large Bugzilla repository of Gnome software
eco-system. Gnome implements user interface functionality, and has
more than 10 years of history and more than 600K issues.
We use term ``issue quality'' to designate the fraction of issues in the sample that were resolved as fixed. For example, a high proportion of invalid or duplicate issue reports would waste time of project participants who need to ascertain the validity of such issues.
We use term ``service quality'' to refer to the time until 90% of the issues are resolved (average time is not a robust measure because of the statistical distribution of resolution times). A shorter resolution time implies rapid response to user concerns, thus representing good service quality.
Each ``RESOLVED'' issue has a resolution, e.g., FIXED, DUPLICATE, INCOMPLETE, or INVALID.
The first simple scenario depicted in the brief video illustrates the adjustment to the policy of reporting issues. The new policy restricted the population of participants who can report issues directly in state ``NEW'' instead of state ``UNCONFIRMED''. Issues in state ``NEW'' are considered to be valid issues while the validity still needs to be established for issues in state ``UNCONFIRMED''.
With ![]() it is easy to detect this change by selecting the issues
that start with state ``NEW'' with the transition filter (see Section IV-D).
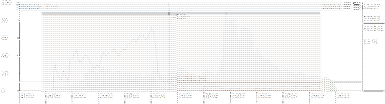
The timeline view shows the dramatic rise from 40% of reported
issues in state ``NEW'' in 2001 rising to 60% in 2003 before
rapidly dropping to 10% after April of 2004 (see the black
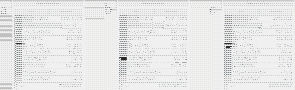
line in Figure 1) . Investigating what happened
in 2001 (by selecting one year interval in the timeline
view and observing the barchart of the distribution of resolutions)
we found that 65% of these ``NEW'' issues were
ultimately fixed, while in 2003 only 60% of them were fixed
(see Figure 2a and 2b).
it is easy to detect this change by selecting the issues
that start with state ``NEW'' with the transition filter (see Section IV-D).
The timeline view shows the dramatic rise from 40% of reported
issues in state ``NEW'' in 2001 rising to 60% in 2003 before
rapidly dropping to 10% after April of 2004 (see the black
line in Figure 1) . Investigating what happened
in 2001 (by selecting one year interval in the timeline
view and observing the barchart of the distribution of resolutions)
we found that 65% of these ``NEW'' issues were
ultimately fixed, while in 2003 only 60% of them were fixed
(see Figure 2a and 2b).
Clearly such drop suggests that the quality of ``NEW'' issues has gone down and that restricting the pool of participants with a privilege to report an issue in ``NEW'' state may improve the situation. The actions undertaken by the project lead to a much smaller fraction of ``NEW'' issues. However, the issue quality did not improve: only 50% of the issues reported as ``NEW'' were fixed in 2004 (Figure 2c) -- an even smaller fraction than in 2003. Furthermore, the service quality also decreased: a calendar year prior to April 2004 it took 9 months to resolve 90% of issues while during the subsequent calendar year it took 9.7 months. It is, therefore, not clear if the intervention achieved its desired goals.
The second example of practice evolution in the
video![]() is driven by the desire to let more Gnome
users participate in issue reporting
via crash reporting tool
Bug-Buddy
is driven by the desire to let more Gnome
users participate in issue reporting
via crash reporting tool
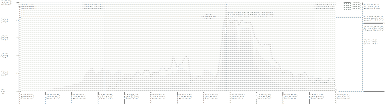
Bug-Buddy ![]() . As
Figure 3 shows, a dramatic peak with 11,600 new
issues is visible in September, 2006, while during the prior month
there were only 2,600 new issues. Of these September new issues,
82% were submitted via Bug-Buddy. While Bug-Buddy was introduced
several years prior to that, the particular version 2.16 that became
available in September has made it much easier
for unsophisticated Gnome users to report
issues.
Earlier, users had to install and configure sendmail package or
report an issue using Bugzilla web site. The innovation initially
looked promising to project participants: ``With
the new Bug-Buddy, we're all receiving tons of new bugs. It's
good, since we now know about some crashers we didn't know
before.''.
. As
Figure 3 shows, a dramatic peak with 11,600 new
issues is visible in September, 2006, while during the prior month
there were only 2,600 new issues. Of these September new issues,
82% were submitted via Bug-Buddy. While Bug-Buddy was introduced
several years prior to that, the particular version 2.16 that became
available in September has made it much easier
for unsophisticated Gnome users to report
issues.
Earlier, users had to install and configure sendmail package or
report an issue using Bugzilla web site. The innovation initially
looked promising to project participants: ``With
the new Bug-Buddy, we're all receiving tons of new bugs. It's
good, since we now know about some crashers we didn't know
before.''.
The volume of new issue reports, however, was overwhelming and the quality was quite low: only 7% of the new issues had stack traces with debugging information. Simply having a stack trace is not as useful as having actual lines of code causing the crash. Users who could now easily report crashes, did not have enough motivation or skill to install debugging libraries which would provide debug symbols, thus improving the quality of the issue reports. Furthermore, 95% of the issues that needed additional information to be reproduced were closed with the resolution of INCOMPLETE because the reporters did not respond to requests for additional information. As one developer put it: ``The NEEDINFO status is nearly killed by these incomplete reports.''
To address these problems, the project introduced
new
technology
and evolved
practices. To
address the issue of missing line numbers Gnome introduced Google
Airbag tool in Bug-Buddy v2.19. Airbag annotates certain crash
reports with compiler-provided debugging information. As a result,
the fraction of invalid issues dropped down to 55% for Bug-buddy
v2.19. From practice's perspective, Gnome community streamlined the
transition UNCONFIRMED![]() NEEDINFO
NEEDINFO![]() RESOLVED
(Figure 4) to UNCONFIRMED
RESOLVED
(Figure 4) to UNCONFIRMED![]() RESOLVED
(Figure 5) in May, 2007. Before the change, 90%
reported issues were resolved within 6.18 months (as shown in
Figure 6). The change resulted in an improvement of
service quality by reducing the delay to 1.14 months.
RESOLVED
(Figure 5) in May, 2007. Before the change, 90%
reported issues were resolved within 6.18 months (as shown in
Figure 6). The change resulted in an improvement of
service quality by reducing the delay to 1.14 months.
To accomplish that ![]() visualizes and compares various properties
of the subsets of issues that a user can interactively select using
a variety of visual and textual (regular expressions) options.
An overview of
visualizes and compares various properties
of the subsets of issues that a user can interactively select using
a variety of visual and textual (regular expressions) options.
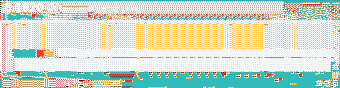
An overview of ![]() is given in Figure 7.
The basic paradigm is that of linked views, where the same set (or sets)
are displayed in a variety of ways to allow:
is given in Figure 7.
The basic paradigm is that of linked views, where the same set (or sets)
are displayed in a variety of ways to allow:
For example, a user can select one year before April, 2004 by brushing the mouse over relevant period in the timeline view. After saving the state (shown in the history panel at top-right), user can select one year after April, 2004. By toggling between these two saved states a user can clearly see what changed. In another scenario, a user may select issues that were resolved and then reopened using a simple regular expression ``S*[UE]'' where S is an abbreviation for resolved, U for unconfirmed, and E for NEW.
Each view of ![]() is designed to present a particular set of
anomalies or to quantify service and issue quality and also serve as
an interactive filter that allows user to select the subsets of
interest for comparison and to quantify issue and service
quality for these subsets.
is designed to present a particular set of
anomalies or to quantify service and issue quality and also serve as
an interactive filter that allows user to select the subsets of
interest for comparison and to quantify issue and service
quality for these subsets.
The timeline view shows trends and serves as date filter. It is represented by an area chart with date on the horizonal axis and chosen statistics on the vertical axis. Statistics include Birth Rate (the number of issues reported during one month), Expiration Rate (the number of issues resolved during the month), and Cumulative Issues (open, but not yet resolved). The timeline view shows two subsets of the selected issue population. The part shown in darker color represents the entire selection while the lighter color shows one part of the selection, for example, issues that are reported as ``NEW''. In addition, the fraction of issues representing the lighter color is drawn as a black line.
The transition view shows frequencies and delays between the states the issues pass through. Circles show states and arcs transitions, with the thickness of the arc indicating one of the following statistics for the selected set: the number of issues having that transitions, the total delay incurred for that transition, and the average delay incurred for that transition. The arcs above the circles go left to right while the ones below circles go right to left.
As noted above, the transition view is linked with the timeline (and other) view(s). In particular, moving the time range in the timeline view shows the animation of the evolution of the transitions among states.
The process view is designed to quantify service quality. It
provides details of the delay for each transition. The horizontal axis
shows delay and the vertical axis shows the numbers of issues. Each
state is drawn in single color with the width representing average time
and the high the number of issues. The area of each state shows the
total time spent transiting between two states in all selected
issues. Time zero represents the time an issue is created and the
time at which next colored region starts indicates delay between the
time the issue was created and the next state.
The transition filter provides visual and textual methods to select subsets of issues that went through chosen state transitions.
The resolution and completeness filters (shown in the top-left of Figure 7) display the number (and fraction) of issues with each resolution and level of completeness in the the current subset. A user may also expand or narrow the current subset of issues by adding (removing) resolutions or levels of completeness to (from) the current subset.
However, the evolution of project practices through issue tracking have been neither investigated, nor quantified. In this study, we visualize the anomalies of issue tracking practices and quantify the relevant effects. We hope to help developers understand the impact of their practices and to design practices.
We are working on applying ![]() in both commercial and open source
projects to help discover and remove inefficiencies in issue
resolution practices.
in both commercial and open source
projects to help discover and remove inefficiencies in issue
resolution practices.